Sunday, February 7, 2016

Does IT Still Not Matter?

I was reading a recent article in Forbes magazine about cloud computing.  In it was a reference to Nicholas Carr’s controversial HBR article “IT Doesn’t Matter.”[1]  Like a bad rash, this article just won’t go away.  Carr refers to IT as no longer mattering since it has become “ubiquitous.”  From a strategic perspective he asserts, IT is “invisible” and now it is just another commodity input like electricity.

During my graduate studies we discussed his article.  While Carr raises several valid points, I concluded that he misses the mark.  I maintain that IT is a strategic asset.  IT only becomes a commodity when viewed and treated as such.

IT is a strategic asset.  It only becomes a commodity when treated as such.

Carr frames IT in the traditional definition of a commodity:  “A basic good used in commerce that is interchangeable with other commodities of the same type.”[2]  In this paradigm, determining your IT strategy is virtually no different than deciding which electric company to power your infrastructure. And as Carr states, “Today, no company builds its business strategy around its electricity usage.”  You simply want the cheapest, most reliable provider.

However, strategy is concerned with how an organization seeks to achieve its goals.[3]  If an organization seeks to leverage their IT to gain a competitive advantage, then IT becomes a strategic asset.  If IT is relegated to only supporting the organization’s strategy, then Carr is correct, IT becomes a commodity. 

Organizations with the commodity mindset focus almost exclusively on what Andrew McAfee categorizes as Function IT (FIT) and Network IT (NIT).[4]  These types of IT include are generally common components such as desktop applications, communication software, and collaboration tools. Organizations that view IT as a strategic asset incorporate McAfee’s third category: Enterprise IT (EIT).  These are large-scale integrated systems that design or redesign business processes.[5] 

EIT can be seen commonly in ERP, SCM and CRM systems, but can be manifest in any enterprise system that seeks to improve or redefine core business functions.  EIT requires careful planning and oversight by senior management to ensure the systems and processes align with business strategy and objectives.  The risk can be high, but the return can be even higher.

When EIT systems are viewed as a commodity, disastrous consequences can arise.  Consider Auto Windscreens, the UK’s second largest auto glass replacement company.  Auto Windscreens used “Oracle On Demand” for call center applications and back-office systems, including their inventory management.  In 2010, Auto Windscreens felt that a similar system at a lower price could be achieved with Metrix.  In other words, the ERP system was viewed as commodity, i.e. virtually the same product but with a differing price.  But delays and problems with the new system, coupled with lower revenues, forced the company into bankruptcy.[6]

Conversely, there are organizations that understand IT can be a strategic asset.  Insurance giant MetLife had been struggling for years to create an integrated customer view.  Seventy separate systems required call center reps to have 15 different screens open.  Some customer service processes required 40 clicks.[7]  In response to the challenges, MetLife developed a home-grown app dubbed “The Wall.”  It provides reps with single-screen, single-click functionality.  This innovative application utilizes big data tools to query data from disparate systems.

As the two examples demonstrate, IT does matter.  In a world were IT is ubiquitous, it is easy to treat IT as commodity much like electricity.  But this is a one-size-fits-all approach which results in IT not being leveraged as a strategic asset for competitive advantage. 

Continuing with the electricity analogy: When your organization is still dependent on electricity, but your competitor implements hydrogen cells for clean and cheap power, you might find yourself at a competitive disadvantage.   
   

References:

1. Carr, Nicholas G.  2003 May. “IT Doesn’t Matter.”  Harvard Business Review.  https://hbr.org/2003/05/it-doesnt-matter *

2. INVESOPEDIA. “Commodity”. http://www.investopedia.com/terms/c/commodity.asp . Accessed December 8, 2015.

3. Brown, Susan.  2015.  “Module 1: Strategy.” Lecture.  The University of Arizona.

4. McAfee, Andrew.  November 2006.  “Mastering the Three Worlds of Information Technology.”  Harvard Business Review.

5. Brown, Susan.  2015.  “Module 2: Funding IT.”  Lecture.  The University of Arizona.

6. Krigsman, Michael.  2011 February 16.  “1100-person company goes bust:  IT failure or mismanagement?”  ZDNet.  http://www.zdnet.com/article/1100-person-company-goes-bust-it-failure-or-mismanagement/

7. Henschen, Doug.  2013 May 5.  “MetLife Uses NoSQL for Customer Service Breakthrough.”  InformationWeek.  http://www.informationweek.com/software/information-management/metlife-uses-nosql-for-customer-service-breakthrough/d/d-id/1109919?page_number=1


* [Excerpt from article] “IT is best seen as the latest in a series of broadly adopted technologies that have reshaped industry over the past two centuries — from the steam engine and the railroad to the telegraph and the telephone to the electric generator and the internal combustion engine. For a brief period, as they were being built into the infrastructure of commerce, all these technologies opened opportunities for forward-looking companies to gain real advantages. But as their availability increased and their cost decreased — as they became ubiquitous — they became commodity inputs. From a strategic standpoint, they became invisible; they no longer mattered.” -- Nicholas Carr

Sunday, December 6, 2015

Visualizing Big Data Networks

“We now live in an economy that is the economy of information, of interconnectedness. In the same way as we had material science, we now have technology.”    -- Albert-lászló Barabási, physicist and network scientist


We live in the era of big data.  It’s so big that all digital data can now be measured in zettabytes (one trillion gigabytes).  What’s equally amazing is the rate this data travels around the globe.  Cisco states that Internet traffic has increased fivefold over the past five years.  In 2016, it is anticipated that Internet traffic will pass the zettabyte threshold.[1] 

Our connectivity to the world is becoming more and more datafied.  Information about our daily interactions are captured online.  These interactions represent our network which is part of a much larger global network.  Networks are collections of entities with relations among them.[2]  In the last decade great strides have been made in measuring and understanding these interactions.

Consider twenty years ago:  My interactions with friends and family were almost entirely analog.  I would call them on a land-line phone, write letters, and conduct face-to-face conversations.  Now the majority of my interactions occur digitally.  I send emails, texts and post Facebook updates.  This digital data can easily be stored, analyzed and graphed.  For example, in the graphic below, Paul Butler visualizes friendship relationships of 500 million people.[3] 


This graph just one sample of the emerging discipline of network science.  Networks can be seen not only within social media, but in many other areas.  Google uses network science to determine search rankings.  Amazon uses it for product recommendations.  Health organizations use it to study disease propagation, and the list goes on and on.

They key is to make sense of complex networks so that meaningful observations can be deducted.  The noted physicist Albert-lászló Barabási asserts that virtually all networks are quantifiable.  By correctly quantifying a network, it is possible to predict and control the network:

“The number of highly connected or less-connected nodes is never random in the network. The way they break down, the way they evolve is never random in these networks. The way that hubs link to their neighborhood, the way the community is formed, the way the communities look, their number, their size, they all follow very precise laws and very quantifiable patterns..... Eventually, if you quantify properly, then you can mathematically formulate. If you mathematically formulate it, then you gain predictive power. If you gain predictive power, eventually you get to the point to be able to control it.”[4]

A powerful tool in understanding networks is visualization.  Visualization lays out the nodes and relationships in an understandable pattern.  In the graphic to the right, medical researchers created a network map of diseases and their associated genes.  The hope is to redefine how diseases are classified and potentially treat them at the genetic level.[5]

Visualizations such as these help analyze the properties of a network.  Many tools such as Gephi are available to analyze and visualize data.  Properties such as centrality, density and clustering coefficient can be measured.  Graphs can be created in different formats to aid in understanding the network.  For example, the graph at the top has a geographic layout.  The disease graph utilizes the force directed layout. 

We live in the zettabyte era of big data.  All our actions and interactions are rapidly being datafied.  As the data collected becomes orders of magnitude larger, so does the complexity of their networks. Network science will play a key role in analyzing the interconnectedness of data entities.  When properly quantified, predicative models can be created.  Graph visualizations can help to understand and communicate these complex networks.  Ultimately these efforts can lead to not only predicting network behavior, but controlling it.


References

1. Cisco.  2015 May.  “The Zettabyte Era—Trends and Analysis.”  White Paper.  http://www.cisco.com/c/en/us/solutions/collateral/service-provider/visual-networking-index-vni/VNI_Hyperconnectivity_WP.html

2.  Ram, Sudha.  2015.  “Business Intelligence – Introduction to Networks.”  The University of Arizona.

3.  Butler, Paul. 2010 December 10.  “Visualizing Facebook Friends: Eye Candy in R.”  http://paulbutler.org/archives/visualizing-facebook-friends/

4.  Barabási, Albert-lászló.  2012 September 24.  “Thinking in Network Terms.”  Edge.org.  http://edge.org/conversation/thinking-in-network-terms

5.  Vidal, Marc; Barabási, Albert-lászló; Cusick, Michael.  2008 May 5.  “Mapping the Human ‘Diseasome’.”  The New York Times.  http://www.nytimes.com/interactive/2008/05/05/science/20080506_DISEASE.html

Thursday, November 19, 2015

Analyzing Web Analytics

My first experience with Web analytics came in the early 2000s.  I was working in a software development team for a large financial firm.  In the past five years we had deployed many new intranet applications.  One application provided branches with a repository of all their standard forms.  Users could search, view and print a PDF copy of a specific form. The application owners added metadata to each form to facilitate more efficient searches.

About six months after deploying the application, the owners wanted to know how many times each form was being accessed and what were the most common search terms.  At the time, we had no way of providing this information.  I took my first look at the web logs and saw gigabytes of rows containing IP addresses, URLs, and HTTP status codes.  Help was needed.  After researching, our team purchased and installed Webtrends on a new server and began doing Web analysis.

Webtrends’ measurements and visualizations were eye opening.  We were able to quickly understand how this application was being used.  Much to our surprise, even though the application was limited to certain regions, it was registering over one million page visits a month.  This valuable insight helped us gain approval to expand our infrastructure to accommodate the full rollout.   Once deployed nationwide, the site was getting nearly two million visits a day.

For the client, we were able to identify the most-used forms and what search terms were being entered to find those forms.  We also were able to identify additional search terms for the metadata in order to help the user find exactly what they were looking for.  Broken links and outdated forms were removed, and user interface enhancements were added based on the trends we were seeing.  For example, we added a “Commonly Used Forms” section on the home page.


Back then, I had never heard of the term Web analytics.  But that is what we were doing.  It is interesting that Avinash Kaushik, author of “Web Analytics 2.0,” would describe our steps nearly nine years later.  He defined Web Analytics as “the analysis of qualitative and quantitative data from your website ... to drive a continual improvement of the online experience that your customers have, which translates into your desired outcomes....[1]”

These steps should be seen as a continuous cycle.  An application seeks to achieve certain goals.  Web usage data is measured, reported and analyzed.  Then the online experience can be optimized to better realize the goals.  New goals are set, and the steps continue.  The process is one of continual improvement. 
For my application, this is exactly what we did.  Using Webtrends and Web analytics we were able to analyze our Web data and modify the application to improve the experience of the customer to achieve the goals of the owner.  This model of continuous improvement was later applied to all our applications. 

Many years later, an enterprise Google search solution was implemented.  Search indexes and results were handled at the corporate level.  Our application now utilized a Google API to perform a search. Web logs were made available to the Google server for analyzing.  With a little sadness I said goodbye to our Webtrends server.  However, I understood it didn’t make sense for every group to run their own $15,000 Web analytics server.

With Google analytics I discovered another world of metrics.  I soon became familiar with key performance indicators (KPI) to measure our goal achievement.  We often focused on the conversion rate.  This measured the proportion of visits that achieved one of our goals.  We also looked at the task completion rate to determine possible pain points in an application [2].

Google analytics had an impressive offering of tools to measure, analyze and visualize Web data.  Even more impressive was that Google freely offered tools to the general public.  Instead of paying thousands of dollars for Web analytics software, it was now available to the masses.  As Kaushik observes, the result was to “create a massive data democracy.  Anyone could quickly add a few lines of JavaScript code to the footer file on their website and possess an easy-to-use reporting tool. The number of people focusing on Web analytics in the world went from a few thousand to hundreds of thousands very quickly [1].”

And the number keeps growing.  Just like big data discussed in previous blogs, Web analytics are becoming a major player in our information age.  Analytics help shape our online experience.  Sometimes it is even the content of our experience.  When viewing my Facebook newsfeed, I saw this post from my niece:

[Side note: Topher is Denise’s six-year-old son who is quite a handful.]

While this might simply look like a cool app to the casual user, it is actually Web analytics.  In Kaushik’s article detailing ten steps to analyze data, this technique is number six.  By using a tag cloud, an analyst can quickly visualize tens of thousands of rows of data.  “Tag clouds are great at understanding the big strategic picture [3].”

Whether it is the big strategic picture or the individual Web page, Web analytics play a key part in gaining valuable insights.  My journey with Web analytics began with an installation of Webtrends.  Before that, I had no idea how many people were using our applications, where they were going or what they were doing.  With the continuing evolution of analytics, it is becoming easy to quickly understand and optimize Web usage.


References

1.  Kaushik, Avinash.  2009.  “Web Analytics 2.0 - The Art of Online Accountability and Science of Customer Centricity.”  Sybex, Wiley.

2.  Waisberg, Daniel.  2010.  “Web Analytics Process - Measurement & Optimization.”  http://online-behavior.com/analytics/web-analytics-process-measurement-optimization

3.  Kaushik, Avinash.  2010 November 15.  “Beginner's Guide To Web Data Analysis: Ten Steps To Love & Success.”  http://www.kaushik.net/avinash/beginners-guide-web-data-analysis-ten-steps-tips-best-practices/

Thursday, November 12, 2015

Taming Big Data with the Data Warehouse

As discussed in Week One, we live in a world of big data, and every day the data grows bigger.  From social media posts to online orders to employee databases, the world is being datafied.  This datafication has resulted in zettabytes of digital information.  The challenge then becomes one of managing the mass of data and creating meaningful information.   Data warehouses play an important role in this regard.

A data warehouse is defined as “an integrated, enterprise-wide collection of high quality information from different databases used to support management decision making and performance management [1].”  Data warehouses are commonly found in medium to large organizations across a wide variety of industries.  During my employment with a large financial institution, I frequently accessed a data warehouse, particularly the data marts specific to our 78 million customers and prospects.

One key phrase mentioned in the definition is “high quality information.”  A data warehouse is only as good as the information it contains.  If the data is not high quality, its use is greatly diminished.  Populating data in a data warehouse is done via extraction, transformation, and loading from other databases and data sources.  Often these databases are various online transaction processing (OLTP) databases.  Data needs to be “cleansed” during the transformation to ensure it is consistent and accurate.

In the case of my company’s customer and prospect data warehouse, data was loaded from a legacy Starbase system (non-relational source of customer transactions), customer relationship management databases, and other related departmental databases.  A nightly process would extract and transform the data to ensure it met all the business rules required before loading into the data warehouse.

From an application development standpoint, the data warehouse provided a single, easily accessible source of costumer data that could be leveraged in our group’s applications.  Other groups accessed the warehouse for their own purposes, e.g. generating reports, doing analytical analysis and data mining.  Often, the information in the data warehouse was referred to as the “single version of the truth.”  While many have argued whether it is possible to truly have such truth [2], having a complete and authoritative source of data within an organization is invaluable.

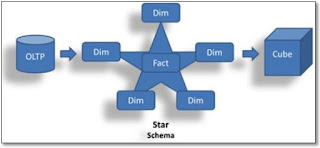
Until I took this Business Intelligence course, I was not familiar with dimensional modeling.  An amusing side note is that when I accessed the data warehouse tables, I couldn’t help but notice that they were not normalized.  At the time, I assumed this was just laziness on the part of the data warehouse team.  Now I understand that the data was dimensionally modeled.  A large fact table contained performance measures.  Other tables, referred to as dimensions, contained the textual attributes.

Dimensional modeling is often referred to as a star schema since it can be represented in a star shape with the fact table in the middle and the dimension tables as points of the star.  The one-to-many relationship between the dimension and the facts are usually prescribed by creating a numeric, sequential surrogate key.  This allows for quicker and more efficient joins and eliminates issues with the natural key changing.

Dimensional modeling lends itself to efficient examination of data.  The different fact dimensions can be thought of abstractly as a multi-dimensional cube.  Analytic processing can be done by slicing the cube, dicing the cube, drilling down, rolling up, and pivoting the cube’s dimensions.  Dashboards can be designed to give users an instant snapshot of information that they can act upon.  Widgets such as gauges, labels, performance bars, and spark lines can help users quickly visual information.

In total, a data warehouse provides a collection of integral data that can be tapped to produce a virtual fire-hose of information.  Data is extracted, transformed and loaded into a dimensional model for optimal performance.  Data can then be analyzed as a multi-dimensional cube to efficiently extract salient information.  Dashboards can be developed to give instant views into the wealth of information stored in a warehouse.


But given the ubiquitous nature of data warehouses currently, what does the future hold now that Hadoop has stormed onto the scene?


The Future of the Data Warehouse and Hadoop

For over 30 years, organizations have relied on data warehouses in various forms to perform data analysis and make business decisions.  In the world of IT, this is nearly a lifetime.  John Foley with Forbes succinctly describes why warehouses have such been around for so long:  “Data warehouses have had staying power because the concept of a central data repository—fed by dozens or hundreds of databases, applications, and other source systems—continues to be the best, most efficient way for companies to get an enterprise-wide view of their customers, supply chains, sales, and operations [3].”

However, a potential competitor to the data warehouse has recently emerged.  “Hadoop is an open-source software framework for storing data and running applications on clusters of commodity hardware [4].”  It promises to deliver much of what the data warehouses do, but at a lower cost.

But while Hadoop seeks to challenge the dominance of data warehouses, currently it is generally used to augment the capacity and processing power of the warehouse.  As one data professional observed, Hadoop can help “reduce the footprint on expensive relational databases.... That makes our data warehouse platform more affordable and frees up capacity for growth, which in turn makes it look more valuable from an economic perspective [5]."


Indeed, one of the biggest drawbacks of a data warehouse is the cost.  Significant infrastructure and personnel resources are required to set up, populate and maintain a warehouse.  As big data continues to grow, so do the resources required to support it.  This is where Hadoop plays an important role.  When budgets are stretched, organizations will look to Hadoop and cloud-based solutions to extend their capacity.  This will herald a change in the data warehouse implementation over the next several years, but will not make it obsolete. 

As GCN observes, “Instead of a one-size-fits-all approach, organizations will look to tailor their big data volumes to hybrid storage approaches [6].”  Consequently, expect Hadoop and similar technologies to complement, not replace, the data warehouse.


References

1.  Ram, Sudha.  2013.  “MIS 587 -- Data Warehouse Design Cycle.”  The University of Arizona.

2.  Kelley, Chuck. 2003 December 10.  “Data warehouse: The single version of truth.”  ITWorld
http://www.itworld.com/article/2785099/storage/data-warehouse--the-single-version-of-truth.html 

3.  Foley, John.  2014 March 10.  “The Top 10 Trends In Data Warehousing.”  Forbeshttp://www.forbes.com/sites/oracle/2014/03/10/the-top-10-trends-in-data-warehousing/

4.  SAS Institute.  “Hadoop:  What is it and why does it matter?”  http://www.sas.com/en_us/insights/big-data/hadoop.html.  Accessed November 12, 2015.

5.  Russom, Philip.  2015 January 27.  “Can Hadoop Replace a Data Warehouse?”  tdwihttps://tdwi.org/articles/2015/01/27/hadoop-replace-data-warehouse.aspx

6.  Daconta, Michael.  2014 January 14.  “Is Hadoop the death of data warehousing?”  GCNhttps://gcn.com/blogs/reality-check/2014/01/hadoop-vs-data-warehousing.aspx

Friday, October 23, 2015

Week One -- The Big (Data) Bang


I attended high school in the mid-1980s.  Back then, the “Internet” was the public library.   Almost everything I needed to know was contained in volumes of books stacked neatly on rows of shelves.  Googling something meant thumbing through a massive compilation of 3x5 Dewey Decimal cards.  Personal computers like the Apple II and Commodore 64 were in their infancy, and electronic data storage was microscopic compared to today’s standards.
In 1994, the year I graduated from college, our computer lab had recently upgraded their servers to one gigabyte hard drives.  I remember being amazed by the capacity of these drives.  A gigabyte seemed beyond my comprehension.  The hard drive on my personal computer could store only 50 megabytes.  I felt that one gigabyte was more than you could ever use.
Fast forward to the year 2015.  The Information Age is in full swing.  My personal computer has a hard drive capacity 2,500 times the size of that one gigabyte server.  We have reached a point where all collective digital data can be measured in zettabytes.  This strange sounding number represents the capacity of one trillion of those gigabyte hard drives.  According to a study by the IDC, digital content will reach 40 zettabytes by 20201.
The reason for this explosive growth can be observed in our daily activities.  Consider the following sampling of online actions that occur every minute2:
  •  Facebook users share 2.5 million pieces of content.
  • Twitter users tweet 277,000 times.
  • Instagram users post nearly 220,000 new photos.
  • YouTube users upload 72 hours of new video content.
  • Apple users download 48,000 apps.
  • Email users send over 200 million messages.
  • Amazon generates over $80,000 in online sales.

This massive and rapidly growing digital universe is often referred to as “big data.”  While the word big seems like an understatement, it is comparable to an astronomer’s reference to the Big Bang.  Both events represent a massive expansion and transformation from very humble beginnings.  Both continue to expand at a mind-boggling rate.  And both are in integral part of the world and universe we now live in.
For example, when I go shopping at my local grocery store, I hand my loyalty card to the cashier.  Every item I purchase is recorded and added to a database.  I always pay with a credit card to get points, and this transaction is added to my purchase history in the credit company’s a data repository.  The cell phone in my pocket provides my general location to my provider.  My Apple Health app records the distance I walk at the store.  And the list goes on and on. 
This stream of captured personal data represents the “datafication” of our world.  Collectively, we are being classified by the data footprint we create.  Whether it is through purchases, status updates, emails, tweets or cell phone calls, we are contributing to our big data profile.  Companies are increasingly using this data to make business decisions and map out their strategy.
               "Datafication is the idea that more and more businesses are dependent
               on their data for their business.
3"

Information Week makes the analogy that datafication has the same impact as electrification did in the late 1800s3.  Just as we cannot imagine a company operating without electricity, today’s businesses are reliant on their information systems’ infrastructure and the collection of big data.  The appetite for such data is insatiable because it offers the possibility of a competitive advantage and profit.  Advertising and marketing can be more effectively targeted.  Applications can become more convenient and useful as they are tailored to our individual habits and preferences.  In one estimate, $72 billion in financial value was derived by European companies that utilized customer data3. 
To realize such positive returns on big data, it needs to be effectively understood and utilized.  In its raw form, big data is a huge, ever-growing, convoluted maze with compartments of segregated information.  It can be structured such as transactions stored on an internal server.  Or it can be unstructured in the form of text on social media. 
This is where Business Intelligence (BI) plays a very important role; it uses big data to produce meaningful insights that can be acted upon by an organization or individual.  Simply having large quantities of data is not useful.  As Harvard Magazine points out, “There is a big data revolution.... But it is not the quantity of data that is revolutionary.  The big data revolution is that now we can do something with the data5.”  Data scientists are linking big data in its various forms and creating visualizations thus making it more meaningful and building predictive models.
As data continues to become bigger, the demand for BI will grow with it.  Data professionals such as business analysts, data warehouse analysts, and data scientists are increasingly in demand.  The University of Arizona recognized the important role big data and BI play in today’s Information Age.  Consequently, they added a Business Intelligence track to its MIS Master’s program.  This class is the capstone of the series.
Even though I still wax a little nostalgic for my library card and Apple IIe computer, Business Intelligence is an interesting and exciting topic of study.  It’s a brave new data world.


1.       Gantz, John and Reinsel, David.  2012 December.  “THE DIGITAL UNIVERSE IN 2020: Big Data, Bigger Digital Shadows, and Biggest Growth in the Far East.”   IDC IVIEW.  https://www.emc.com/collateral/analyst-reports/idc-the-digital-universe-in-2020.pdf.
 
2.       Gunelius, Susan.  2014 July 12.  “The Data Explosion in 2014 Minute by Minute – Infographic.”  ACI.   http://aci.info/2014/07/12/the-data-explosion-in-2014-minute-by-minute-infographic/.
 
3.       Bertolucci, Jeff.  2013 February 25.  “Big Data's New Buzzword: Datafication.”  InformationWeek.  http://www.informationweek.com/big-data/big-data-analytics/big-datas-new-buzzword-datafication/d/d-id/1108797.

4.       Regalado, Antonio and Leber, Jessica.  2013 May 20.  “Intel Fuels a Rebellion Around Your Data.”  MIT Technology Review.  http://www.technologyreview.com/news/514386/intel-fuels-a-rebellion-around-your-data/.

5.       Shaw, Jonathan.  2014 March - April.  “Why ‘Big Data’ Is a Big Deal.”  Harvard Magazine.  http://harvardmagazine.com/2014/03/why-big-data-is-a-big-deal.

Thursday, October 22, 2015

A Brief Introduction: My Mid-Life Crises Theory


When young, people ask what you want to be when you grow up.  The possibilities have no limits when your age is in the single digits.  Becoming an astronaut seems no more difficult than working as a burger flipper at McDonalds.

As time and circumstance happen to everyone, the possibilities narrow.  Decisions are made that set a person on a path that becomes harder and harder to change.  Choosing a college, a major, a career and a spouse begin to cast the mold of a person’s life.

Now consider my mid-life crises theory:  Once we reach the approximate mid-point of our life, our brains begin to weigh the aspirations we had when young to how things are actually turning out.  Many of us discover that we didn’t become the astronaut who travels to the moon.  Instead, we drive an economical car to a generic office building and sit in a small cubicle typing on our computers.

Sometimes this can lead to changing our course is some shape or form.   Maybe it is buying the uneconomical sports car.  Or maybe it is changing jobs or going back to school.  Whatever the change, it affords the feeling of having some semblance of control still -- that maybe there are still endless possibilities.

As I approached middle age, I made several such course corrections.  For the most part, I was happy with my life.  However, unexpected life events can result in unforeseen changes.  This is what happened to me.  After working over 17 years for one of the largest financial institutions in the country, I saw the writing on the wall.  The company was outsourcing its information systems at a quickening pace.  People I had worked with for years were let go.  Soon, I was the only original member left on my team.

To prepare for the inevitable, I retired from the National Guard.  I knew from watching other Soldiers how hard it can be looking for a job when a potential employer knows that you can be called away from work.  I also knew it was time to refresh the schooling on my resume.  Consequently, I enrolled in the Master’s in MIS online program at the University of Arizona (UA).

As anticipated, I was told that I could either transfer to Ohio to continue my employment or take a severance.  My decision was to part ways and chart a new course.   With the money from my severance, and with the help of the G.I. Bill, I focused on my degree.  After graduation, I will see what new opportunities I can find.

The “Business Intelligence” named in the blog title represents one of my last two classes.  If all goes as planned, I will be graduating this December.  This blog will contain my thoughts and observations on topics covered in class over the next seven weeks.